
How Natural Gas Pipeline Buildout Is Changing, Mapped
Pipeline growth shifts toward more interstate pipe and compression, expanding in the Southeast and Midcon as Appalachia stays constrained.

Originally published for customers August 26, 2026.
What’s the issue?
If planned interstate natural gas pipelines enter service on schedule, total U.S. interstate capacity could approach 300 Bcf/d by 2029.
Why does it matter?
The numbers alone do not show how the projected buildout compares with historical growth rates or capture permitting and construction risks that could affect the underlying in-service targets.
What’s our view?
Growth has been steady, but the pace of this buildout is faster. Stronger demand and more favorable permitting conditions support that pace, but elusive wholesale permitting reform means risk remains.
If planned interstate natural gas pipelines enter service on schedule, total U.S. interstate capacity could approach 300 Bcf/d by 2029. The numbers alone do not show how the projected buildout compares with historical growth rates or capture permitting and construction risks that could affect the underlying in-service targets. Growth has been steady, but the pace of this buildout is faster. Stronger demand and more favorable permitting conditions support that pace, but elusive wholesale permitting reform means risk remains.
As discussed in How Natural Gas Pipeline Buildout Is Changing, Mapped, the current pipeline queue is unfolding in two stages. Projects targeting 2026 and 2027 are concentrated on moving growing supply toward major Gulf Coast transportation networks and LNG demand. Beginning in 2028, development spreads farther across the interstate system, with more projects expanding and connecting existing networks to serve power generation, industrial activity, data centers, and other regional demand. That later wave also requires substantially more pipeline mileage and compression.
Looking at the longer history of interstate pipeline capacity puts that projected buildout into context. As shown below, estimated U.S. interstate natural gas transmission capacity increased from approximately 155.95 Bcf/d in 2011 to 255.96 Bcf/d in 2025, an increase of roughly 64%.
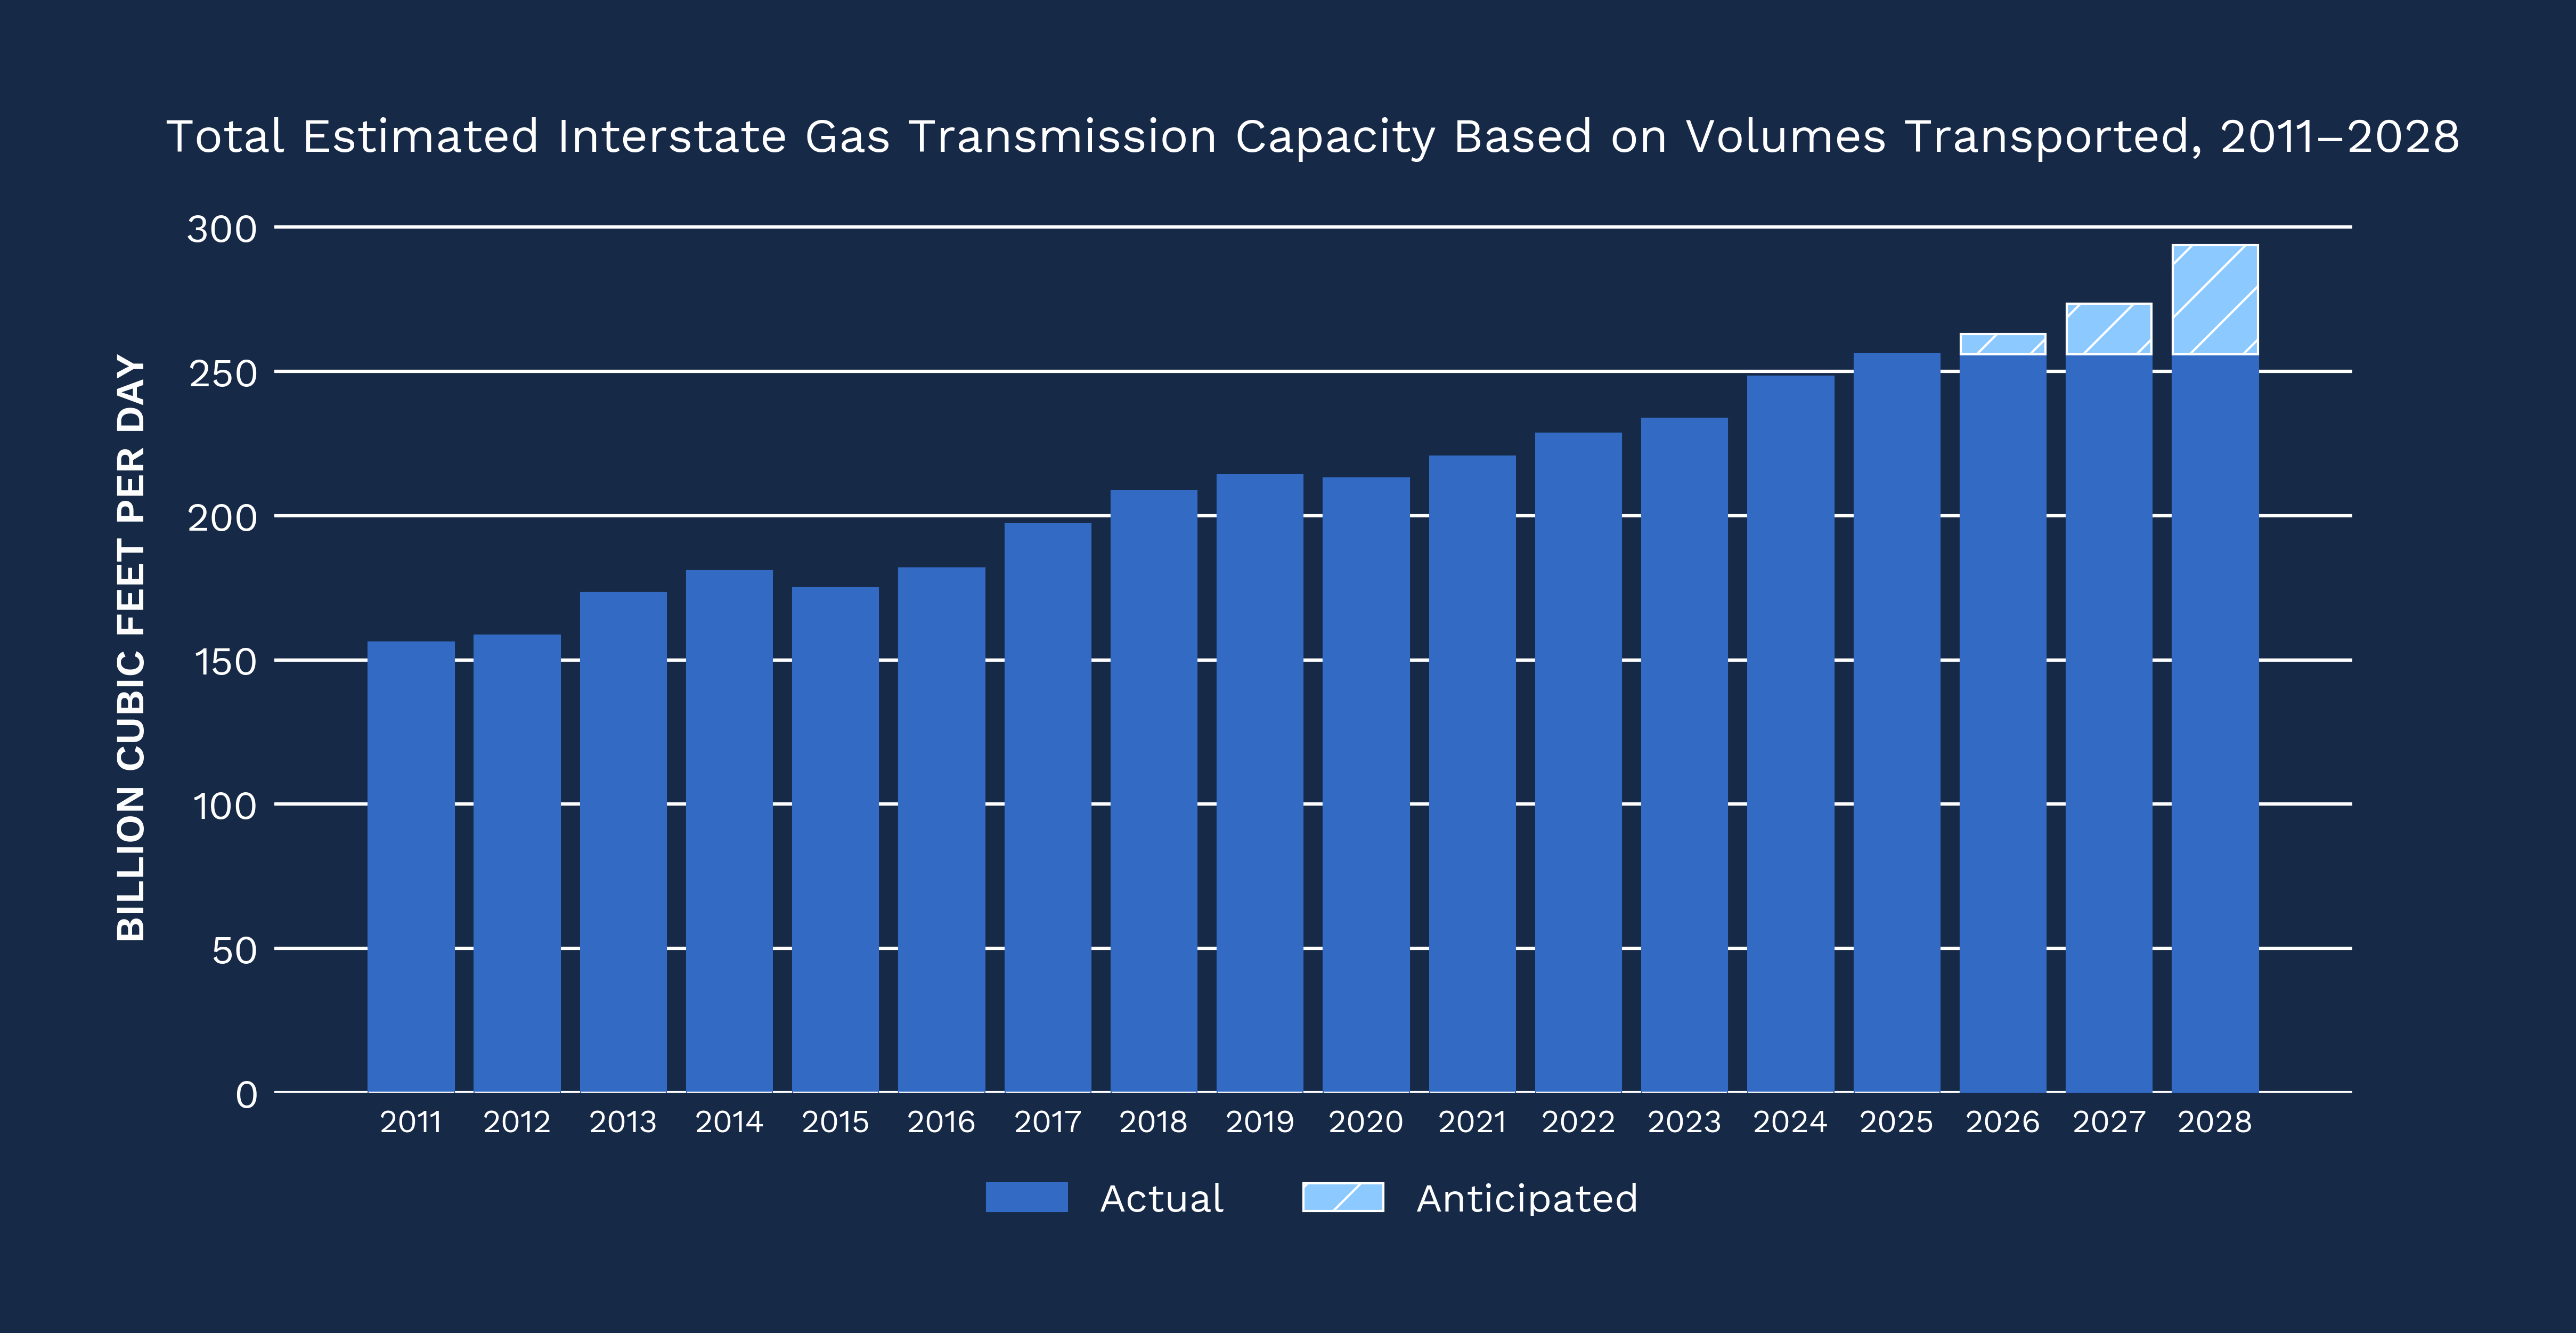
We estimated total interstate natural gas transmission capacity using annual FERC Form 2 and Form 2A filings. Using our data acquisition system, we used reported peak-day deliveries for major pipelines (defined by FERC as those transporting or storing at least 50 million dekatherms of gas annually); for non-major pipelines, we used total deliveries net of gathering and distribution deliveries. We then aggregated those estimates across all reporting pipelines for each year.
Adding anticipated capacity from the interstate projects identified in our prior analysis would bring total capacity to approximately 293.70 Bcf/d by 2029 if those projects enter service on their current schedules. That is roughly 37.74 Bcf/d of additional capacity from the 2025 baseline, or almost 15% growth in only a few years. For added context, from 2011 through 2025, estimated interstate capacity grew at an average annual rate of about 4%. The current project queue would increase that pace to roughly 6% per year, about 50% faster.
Several recent federal changes have reduced constraints that affected pipeline development during the last several years.The most important change so far is reduced litigation risk related to NEPA after the Seven County decision, in which the Supreme Court gave federal agencies more room to define the scope of their environmental reviews and limited how aggressively courts can second-guess those judgments.
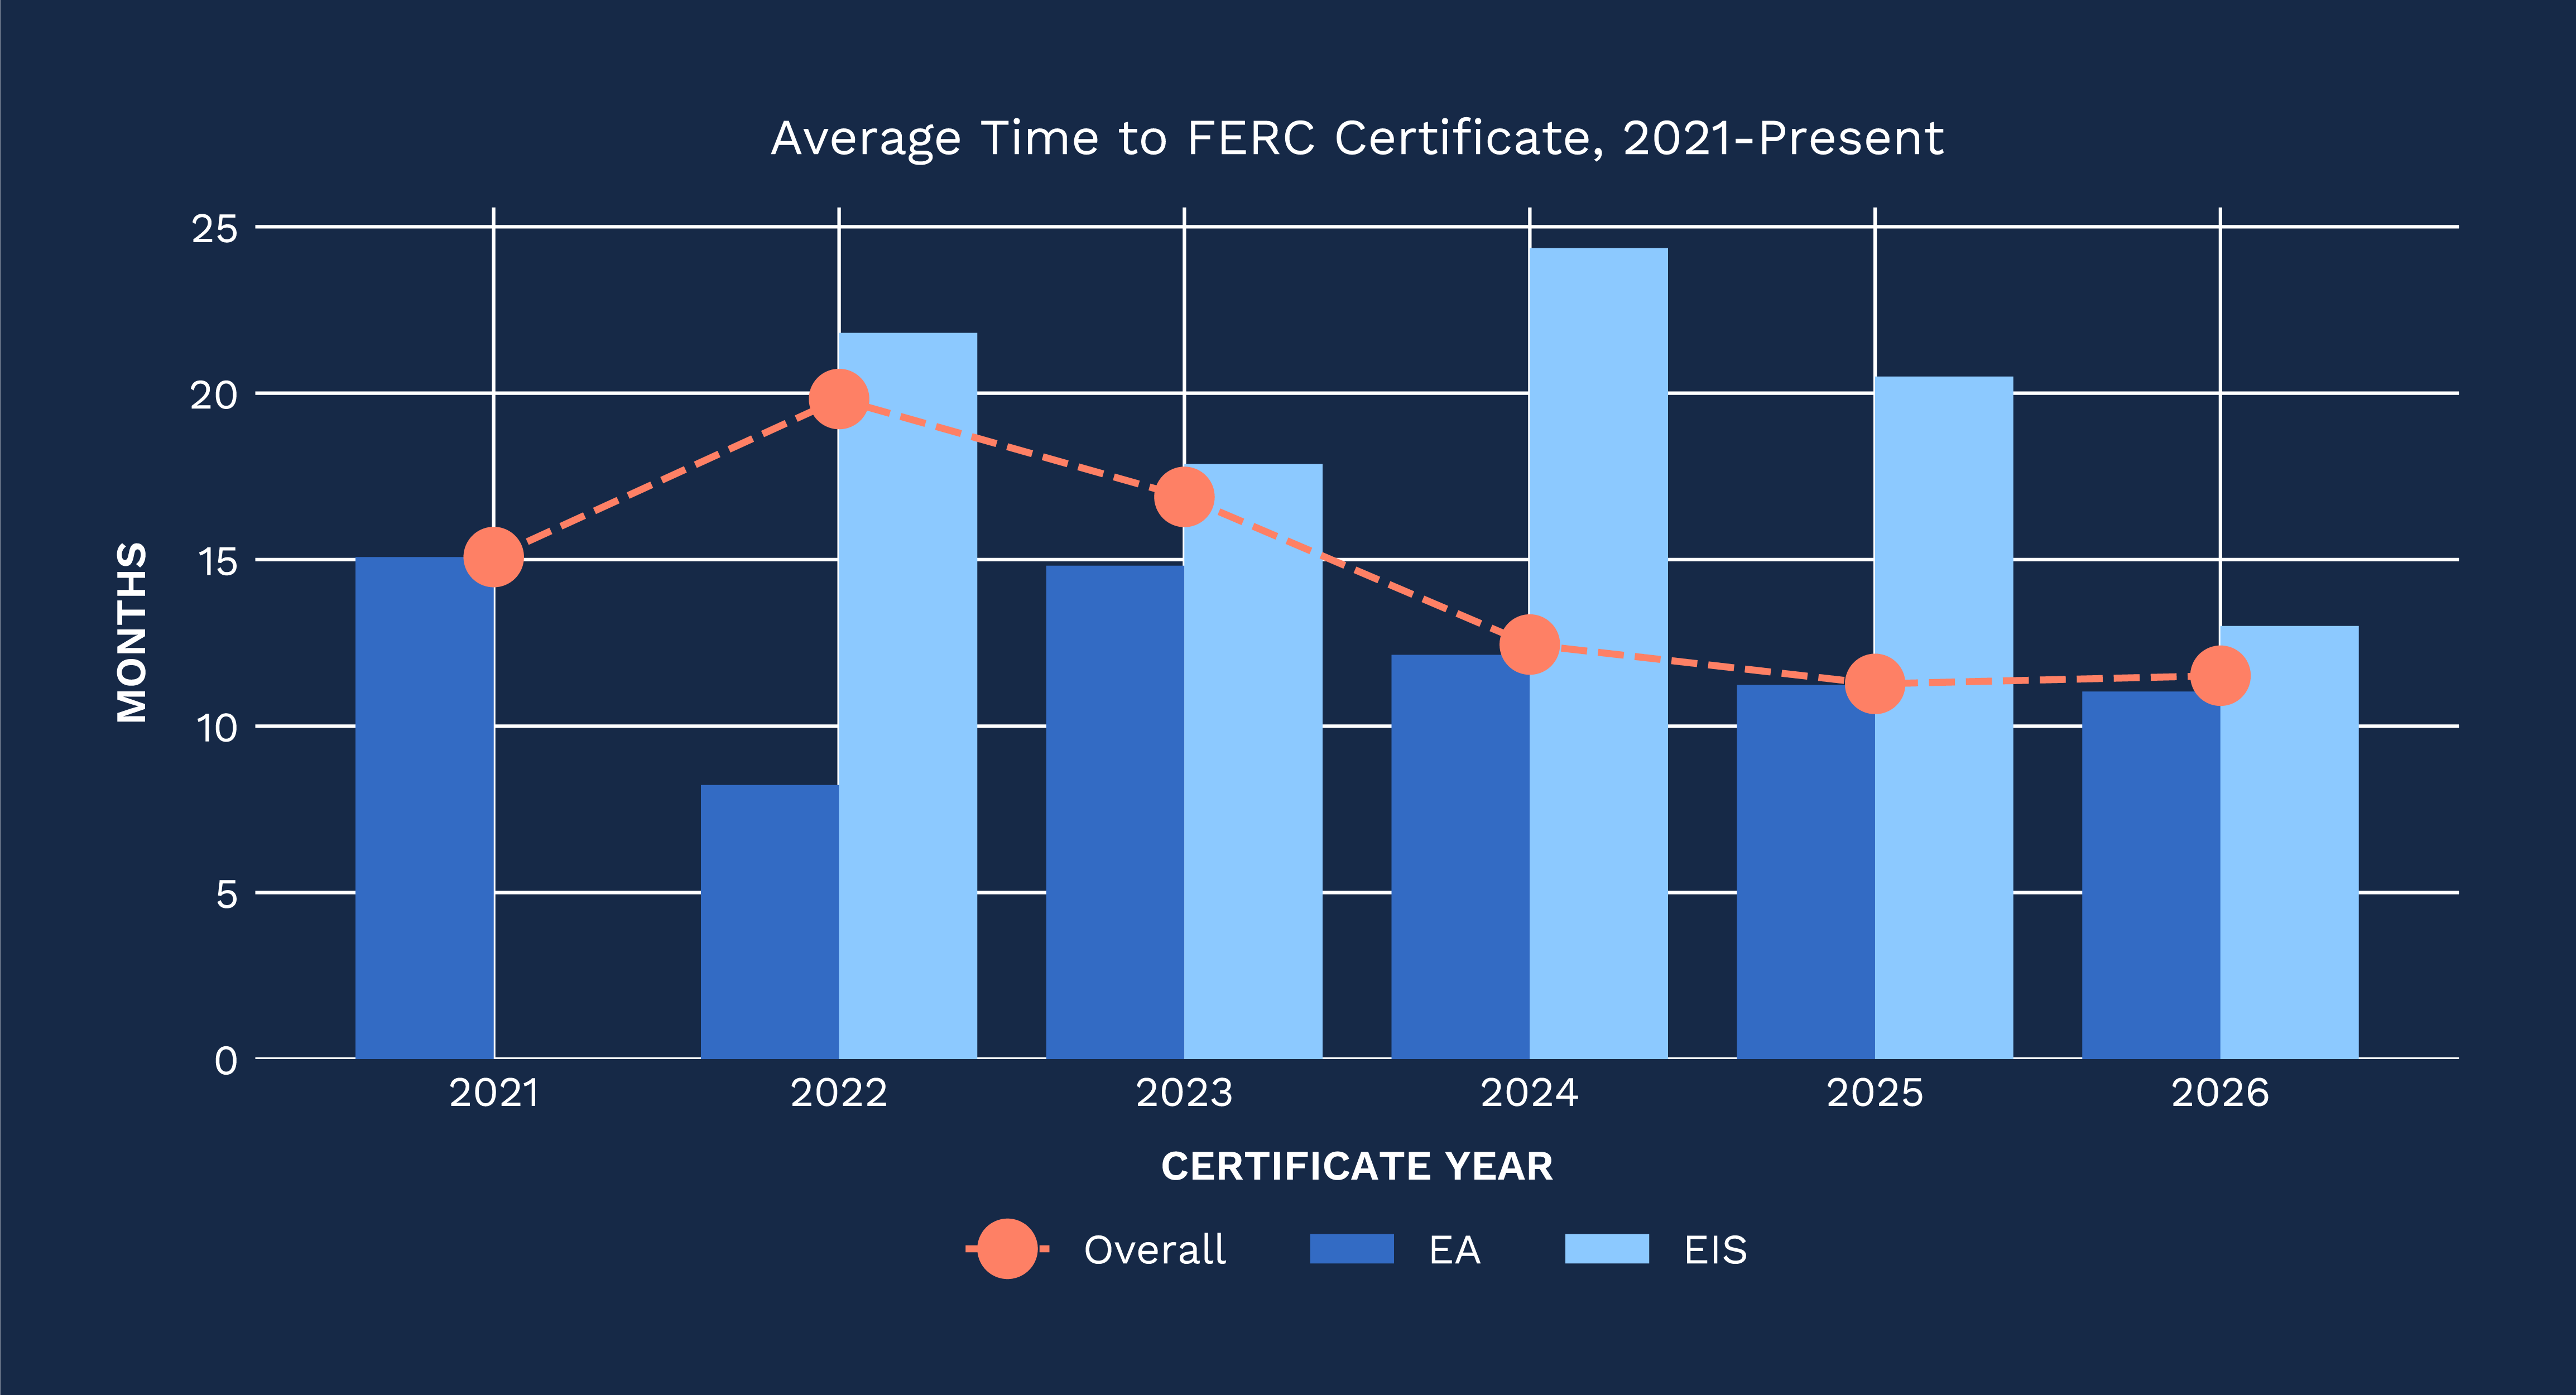
FERC has also removed or proposed changes to several procedural constraints. The Commission repealed Order No. 871, which had prevented certificate holders from beginning construction while rehearing requests were pending. Our earlier analysis in The INGAA Two-Step: Waivers Now, Reforms Later? found that projects filed in the five years before Order No. 871 took a median of 80 days to obtain a Notice to Proceed with Construction, compared with 183 days for projects filed afterward. The Commission has also vocally focused on prioritizing staff resources toward the most analytically challenging projects, resulting in a trend of faster reviews and greater use of Environmental Assessments as shown below:
As discussed in Bigger Blankets and Faster Steel: FERC’s May Commission Meeting, FERC is also pursuing broader changes to the blanket certificate program by expanding it to LNG projects, raising cost thresholds, extending the in-service deadline, expanding eligibility for some facilities, and removing cost limits for certain prior-notice compression projects within existing footprints. Those reforms are more relevant to smaller expansions than major greenfield projects, but they could ease development on parts of the existing system as the project mix shifts toward expansions and connections.
Of course project opposition has not gone anywhere. As discussed in Desert Southwest and Bakken East: Comments Follow the Terrain, recent comment activity shows opposition around familiar environmental topics as well as cultural-resource, landowner, agricultural, and >Wholesale permitting reform resolving some of these issues remains elusive in Congress, though proposals keep finding their way into new bills. So as it stands, federal permitting conditions have meaningfully improved, but the buildout still depends on projects clearing key approvals, litigation, and opposition. Risk analysis of these issues are not easily generalized because so much of it is site specific. But we will continue to follow them all and highlight trends where they emerge.
Browse recent blogs about a similar topic.
Pipeline growth shifts toward more interstate pipe and compression, expanding in the Southeast and Midcon as Appalachia stays constrained.

U.S. gas storage stayed flat as LNG exports surged. Arbo tracks Texas gas storage projects through Railroad Commission permits, not developer claims.

FERC’s July meeting set a mandatory NERC data center reliability standards deadline and cleared Leaf River’s storage expansion.